
Monitoring System Resources
Keep your Xilica system running at peak performance by regularly monitoring resource usage.
Accessing Resource Information
Method 1: From Network View
Right-click on your device in Network View
Select "Device Setup"
Navigate to the "Resource Usage" tab
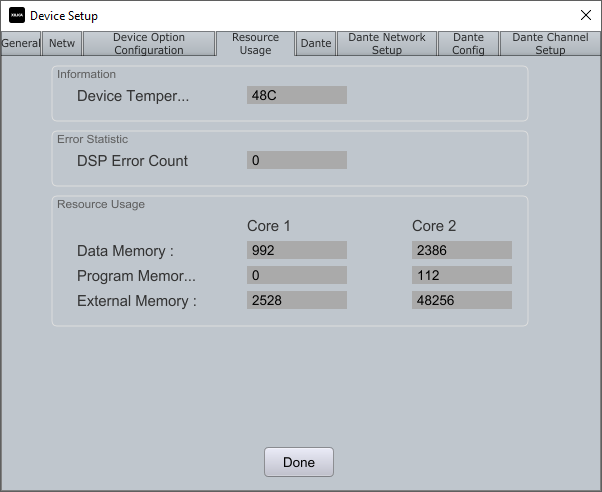
This view provides:
Current device temperature
Error statistics
Memory allocation (data, program, and external)
Method 2: From Project View
Double-click the Solaro device block in Project View
Select the background of the device schematic
Locate the Resource Usage section in the Object Property menu
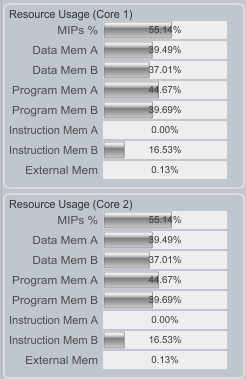
This view displays:
MIPs percentage
Memory allocation details
Instruction memory usage
Module-Specific Monitoring
To view resources for individual components:
Select a specific DSP module within the schematic
Resource usage for that module will appear in the properties panel
Important Performance Notes
Estimated resources appear when designing offline
Actual resource usage displays when the device is online
If MIPs percentage exceeds 100%, your design may fail to load or operate incorrectly
Regular monitoring helps prevent performance issues before they impact your system